High Quality Short Duration 0-2 Year
STRATEGY HIGHLIGHTS
The management team seeks to invest in high quality, low-volatility alternatives to low-yielding money market and government debentures. We target short-term bonds that we believe to be of the highest quality with low credit and event risk. The team seeks to protect principal and generate a consistent source of income and liquidity. Traditional short-term, low volatility mortgage- and asset-backed securities are emphasized because of their historical substantial yield premium versus Treasury and agency notes.
Key Stats
| Asset Class: | US Fixed Income | |||
| Inception Date: | July 1, 1999 | |||
| Average Credit Quality: | AAA | |||
| Non-AAA Exposure: | 0% | |||
| Yield to Maturity: | 4.5% | |||
| Modified Duration (years): | 0.9 | |||
| Average Maturity (years): | 0.9 | |||
| Duration Target: | 0.5 - 1.5 years | |||
| Benchmark: | ICE BofA 1 Yr Treasury | |||
LOW VOLATILITY |
Below Peer Group1 |
ULTRA HIGH CREDIT QUALITY |
100%
'AAA' & Government |
MODIFIED DURATION |
0.9
Years |
PERFORMANCE ANALYSIS
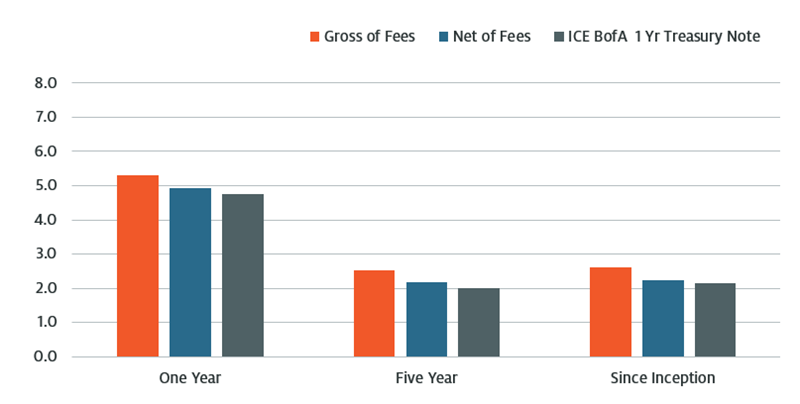
Investment Performance (%)
as of December 31, 2024

| Quarter | 1 Yr | 3 Yr | 5 Yr | 10 Yr | Since Inception | |
|---|---|---|---|---|---|---|
| High Quality 0-2 Year (Gross) | 0.94 | 5.29 | 3.50 | 2.53 | 2.01 | 2.60 |
| High Quality 0-2 Year (Net) | 0.86 | 4.92 | 3.14 | 2.17 | 1.66 | 2.24 |
| T-Bill Spliced w/ICE BofA 1 Yr Treasury | 0.70 | 4.75 | 2.78 | 2.01 | 1.63 | 2.14 |
Periods greater than one year are annualized. Inception date is 7/1/99.
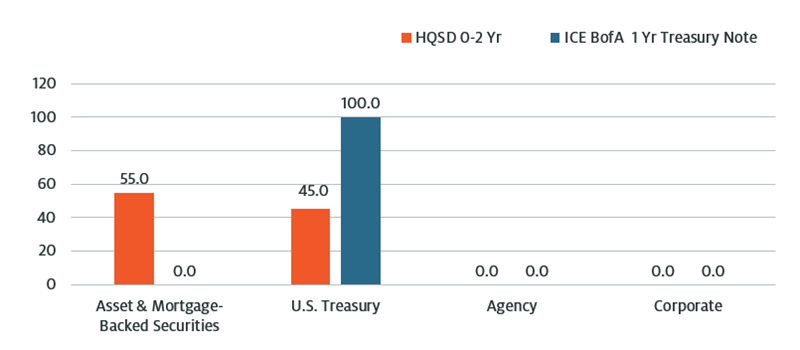
EMPHASIS ON SECURITIZED SECTORS
Sector Allocation (%)
as of December 31, 2024

Cash allocation included in U.S. Treasury. Percentages based on weighted average of composite portfolios.
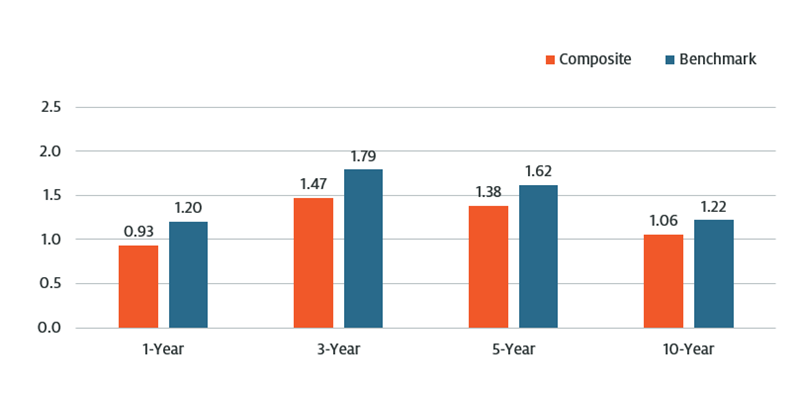
STANDARD DEVIATION (%)
As of December 31, 2024

Annualized gross of fee returns. Standard deviation (risk) measures the dispersion of returns (historic volatility). 1Peer group: products reporting a one-year maturity benchmark within the eVestment US Enhanced Cash Management Universe (includes products primarily invested in ultra-short, investment grade debt while maintaining some exposure to higher-yielding securities or sectors to enhance returns). Volatility measured by the 10-year standard deviation of product returns for eight strategies. Percentile rankings reflect where those returns fall within the peer group. The Composite’s 10-year low volatility measure ranked in the top 11th percentile among 10 strategies.
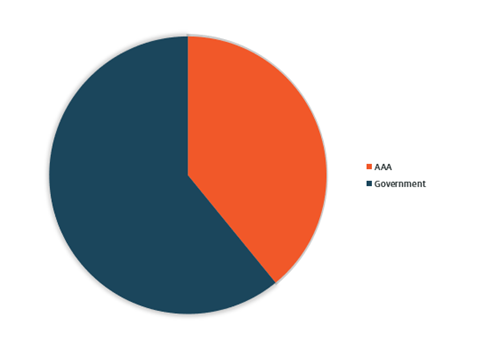
EMPHASIS ON HIGHEST QUALITY ISSUES
Credit Quality*
as of December 31, 2024

Investment Background
- 25+ years managing high-quality bonds
- $1.3 billion in short duration assets
- Focus on securitized debt instruments
- Custom portfolio tailored to investment needs
STRATEGY DOCUMENTS
*Source: Aladdin. Percentages may not sum to 100 due to rounding. Cash allocation included in Government weighting, which includes government debentures and mortgage securities. Percentages based on weighted average of composite portfolios.
Average Credit Quality calculated as of current quarter-end by Atlanta Capital. The Strategy’s overall average portfolio credit quality is not assigned by an independent credit agency. Rather, it is calculated by the investment adviser by determining the average credit quality of the Strategy’s investments (including cash held in government money market funds) based on their market value. If individual securities within the portfolio are rated differently by the independent credit agencies, the higher rating is used to calculate the average portfolio credit quality. Unrated securities are included based on internally assigned ratings. Average credit quality may change over time.
Ratings are based on Moody’s, S&P or Fitch, as applicable. Credit ratings are based largely on the rating agency’s investment analysis at the time of rating and the rating assigned to any particular security is not necessarily a reflection of the issuer’s current financial condition. The rating assigned to a security by a rating agency does not necessarily reflect its assessment of the volatility of a security’s market value or of the liquidity of an investment in the security. If securities are rated differently by the rating agencies, the higher rating is applied. Ratings of BBB or higher by Standard and Poor's or Fitch (Baa or higher by Moody’s) are considered to be investment grade quality.
Risk Considerations
About Risk: Investing involves risk, including possible loss of principal. Diversification does not eliminate the risk of loss. The value of investments may increase or decrease in response to economic and financial events (whether real, expected or perceived) in the U.S. and global markets. developments. Investments rated below Investment Grade (typically referred to as “junk”) are generally subject to greater price volatility and illiquidity than higher rated investments. Credit Risk: Investments in income securities may be affected by changes in the creditworthiness of the issuer and are subject to the risk of non-payment of principal and interest. The value of income securities also may decline because of real or perceived concerns about the issuer’s ability to make principal and interest payments. Duration Risk: Securities with longer durations tend to be more sensitive to interest rate changes than securities with shorter durations. Government Agency Risk: While certain U.S. Government sponsored agencies may be chartered or sponsored by acts of Congress, their securities are neither issued nor guaranteed by the U.S. Treasury. Income Market Risk: An imbalance in supply and demand in the income market may result in valuation uncertainties and greater volatility, less liquidity, widening credit spreads and a lack of price transparency in the market. Interest Rate Risk: As interest rates rise, the value of certain income investments is likely to decline. Maturity Risk: Longer-term bonds typically are more sensitive to interest rate changes than shorter-term bonds. Prepayment Risk: Mortgage-backed securities are subject to prepayment risk.
The views and opinions are those of the author as of the date of publication and are subject to change at any time due to market or economic conditions and may not necessarily come to pass. The views expressed do not reflect the opinions of all investment personnel at Morgan Stanley Investment Management (MSIM) and its subsidiaries and affiliates (collectively the Firm”), and may not be reflected in all the strategies and products that the Firm offers.
This material is for the benefit of persons whom the Firm reasonably believes it is permitted to communicate to and should not be forwarded to any other person without the consent of the Firm. It is not addressed to any other person and may not be used by them for any purpose whatsoever. It expresses no views as to the suitability of the investments described herein to the individual circumstances of any recipient or otherwise. It is the responsibility of every person reading this material to fully observe the laws of any relevant country, including obtaining any governmental or other consent which may be required or observing any other formality which needs to be observed in that country. Unless otherwise stated, returns and market values contained herein are presented in U.S. dollars.
This material is a general communication, which is not impartial, is for informational and educational purposes only, not a recommendation to purchase or sell specific securities, or to adopt any particular investment strategy. Information does not address financial objectives, situation or specific needs of individual investors.
Any charts and graphs provided are for illustrative purposes only. Any performance quoted represents past performance. Past performance does not guarantee future results. All investments involve risks, including the possible loss of principal.
Prior to making any investment decision, investors should carefully review the strategy’s relevant offering document. For the complete content and important disclosures, refer to the GIPS Disclosure link on this page.
© 2025 Morgan Stanley. All rights reserved.


